The scientists who study how climates are created and what they do to the environment are called climatologists.
Climatologists use similar tools as meteorologists (such as thermometers, barometers, and rain gauges) in order to gather data to figure out the average temperatures and precipitation rates for an area. This data is then recorded and used for years to come.
A way that we can compare the climates of the world is through the use of climograph. A climograph is just like what is sounds like: A graph of climatic data through an annual cycle that displays climatic elements such as temperature and precipitation.
Below is an example of a Climograph.
The Red line near the top shows the average temperature of each month.
The Blue bar graph shows the average precipitation of each month.
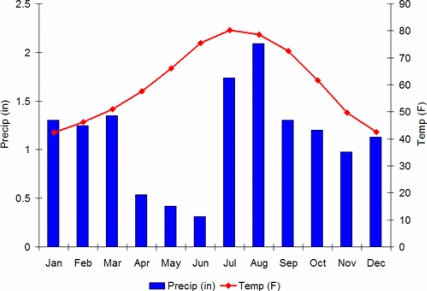
What observations can you make about this climograph? What sort of climate do you think this is? Is this a cooler or a warmer climate?

Go back to "What is climate?"
|

Go onto "Comparing Weather and Climate"!
|
